





Jupyter notebooks#
You can also create content with Jupyter Notebooks, using the MyST-NB Sphinx extension.
This page demonstrates some extra functionality that works with this theme.
Markdown + notebooks#
As it is markdown, you can embed images, HTML, etc into your posts!

You an also \(add_{math}\) and
or
But make sure you $Escape $your $dollar signs $you want to keep!
Code blocks and image outputs#
Jupyter Book will also embed your code blocks and output in your book. For example, here’s some sample Matplotlib code:
Show code cell content
from matplotlib import rcParams, cycler
import matplotlib.pyplot as plt
import numpy as np
# Fixing random state for reproducibility
np.random.seed(19680801)

N = 10
data = [np.logspace(0, 1, 100) + np.random.randn(100) + ii for ii in range(N)]
data = np.array(data).T
cmap = plt.cm.coolwarm
rcParams['axes.prop_cycle'] = cycler(color=cmap(np.linspace(0, 1, N)))


from matplotlib.lines import Line2D
custom_lines = [Line2D([0], [0], color=cmap(0.), lw=4),
                Line2D([0], [0], color=cmap(.5), lw=4),
                Line2D([0], [0], color=cmap(1.), lw=4)]

fig, ax = plt.subplots(figsize=(10, 5))
lines = ax.plot(data)
ax.legend(custom_lines, ['Cold', 'Medium', 'Hot']);
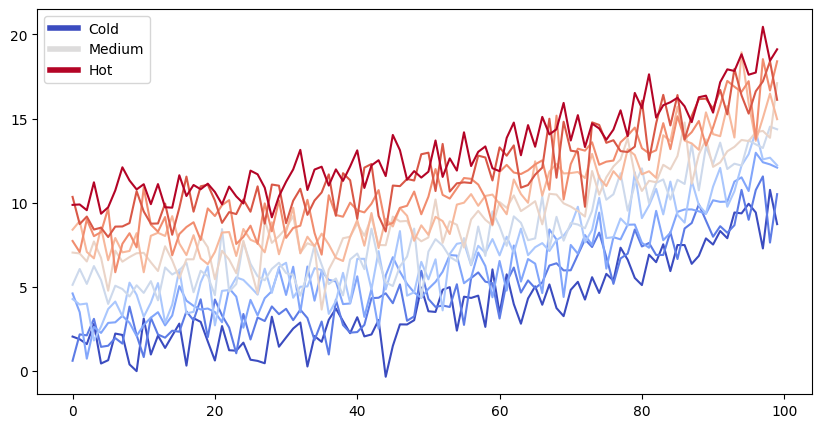
Note that the image above is captured and displayed.
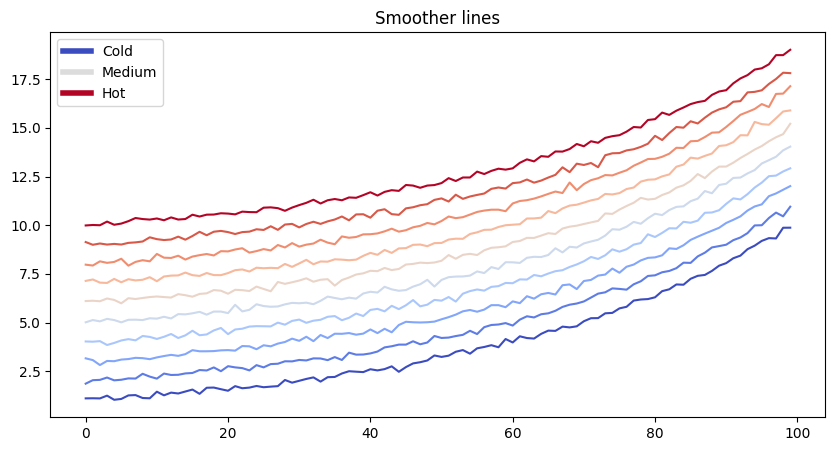
print("this works for code cells too, if you add a `margin` tag to them")
this works for code cells too, if you add a `margin` tag to them
# You can also include enriched outputs like Math
from IPython.display import Math
Math("\sum_{i=0}^n i^2 = \frac{(n^2+n)(2n+1)}{6}")
Removing content before publishing#
You can also remove some content before publishing your book to the web. For example,
in ./notebooks.ipynb, there used to be a cell below…
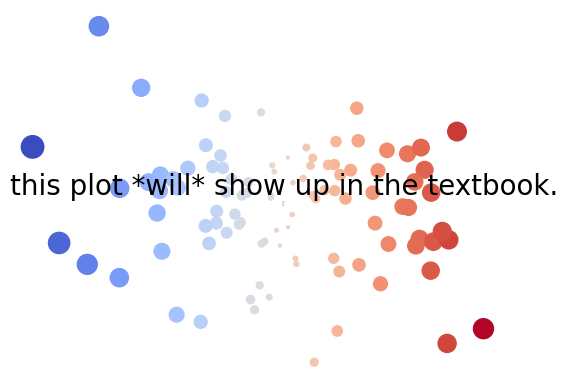
You can also remove only the code so that images and other output still show up.
Below we’ll only display an image. It was generated with Python code in a cell,
which you can see in the original notebook.
thisvariable = "this plot *will* show up in the textbook."

fig, ax = plt.subplots()
x = np.random.randn(100)
y = np.random.randn(100)
ax.scatter(x, y, s=np.abs(x*100), c=x, cmap=plt.cm.coolwarm)
ax.text(0, .5, thisvariable, fontsize=20, transform=ax.transAxes)
ax.set_axis_off()
And here we’ll only display a Pandas DataFrame.
import pandas as pd
df = pd.DataFrame([['hi', 'there'], ['this', 'is'], ['a', 'DataFrame']], columns=['Word A', 'Word B'])
df
| Word A | Word B | |
|---|---|---|
| 0 | hi | there |
| 1 | this | is |
| 2 | a | DataFrame |
You can even style Pandas DataFrames! See the Pandas Styling docs for more information.
Show code cell source
import pandas as pd

np.random.seed(24)
df = pd.DataFrame({'A': np.linspace(1, 10, 10)})
df = pd.concat([df, pd.DataFrame(np.random.randn(10, 4), columns=list('BCDE'))],
               axis=1)
df.iloc[3, 3] = np.nan
df.iloc[0, 2] = np.nan

def color_negative_red(val):
    """
    Takes a scalar and returns a string with
    the css property `'color: red'` for negative
    strings, black otherwise.
    """
    color = 'red' if val < 0 else 'black'
    return 'color: %s' % color

def highlight_max(s):
    '''
    highlight the maximum in a Series yellow.
    '''
    is_max = s == s.max()
    return ['background-color: yellow' if v else '' for v in is_max]

df.style.\
    applymap(color_negative_red).\
    apply(highlight_max).\
    set_table_attributes('style="font-size: 10px"')
/tmp/ipykernel_802/645148677.py:27: FutureWarning: Styler.applymap has been deprecated. Use Styler.map instead.
  applymap(color_negative_red).\
| A | B | C | D | E | |
|---|---|---|---|---|---|
| 0 | 1.000000 | 1.329212 | nan | -0.316280 | -0.990810 |
| 1 | 2.000000 | -1.070816 | -1.438713 | 0.564417 | 0.295722 |
| 2 | 3.000000 | -1.626404 | 0.219565 | 0.678805 | 1.889273 |
| 3 | 4.000000 | 0.961538 | 0.104011 | nan | 0.850229 |
| 4 | 5.000000 | 1.453425 | 1.057737 | 0.165562 | 0.515018 |
| 5 | 6.000000 | -1.336936 | 0.562861 | 1.392855 | -0.063328 |
| 6 | 7.000000 | 0.121668 | 1.207603 | -0.002040 | 1.627796 |
| 7 | 8.000000 | 0.354493 | 1.037528 | -0.385684 | 0.519818 |
| 8 | 9.000000 | 1.686583 | -1.325963 | 1.428984 | -2.089354 |
| 9 | 10.000000 | -0.129820 | 0.631523 | -0.586538 | 0.290720 |
Testing margins before headers
Interactive outputs#
We can even do the same for interactive material. Below we’ll display a map using folium. When the notebook is converted to Markdown, the code for creating the interactive map is retained.
Note that this will only work for some packages. They need to be able to output standalone HTML/Javascript, and not depend on an underlying Python kernel to work.
import folium
m = folium.Map(
    location=[45.372, -121.6972],
    zoom_start=12,
    tiles='Stamen Terrain'
)

folium.Marker(
    location=[45.3288, -121.6625],
    popup='Mt. Hood Meadows',
    icon=folium.Icon(icon='cloud')
).add_to(m)

folium.Marker(
    location=[45.3311, -121.7113],
    popup='Timberline Lodge',
    icon=folium.Icon(color='green')
).add_to(m)

folium.Marker(
    location=[45.3300, -121.6823],
    popup='Some Other Location',
    icon=folium.Icon(color='red', icon='info-sign')
).add_to(m)


m
---------------------------------------------------------------------------
ValueError                                Traceback (most recent call last)
Cell In[11], line 1
----> 1 m = folium.Map(
      2     location=[45.372, -121.6972],
      3     zoom_start=12,
      4     tiles='Stamen Terrain'
      5 )
      7 folium.Marker(
      8     location=[45.3288, -121.6625],
      9     popup='Mt. Hood Meadows',
     10     icon=folium.Icon(icon='cloud')
     11 ).add_to(m)
     13 folium.Marker(
     14     location=[45.3311, -121.7113],
     15     popup='Timberline Lodge',
     16     icon=folium.Icon(color='green')
     17 ).add_to(m)

File ~/checkouts/readthedocs.org/user_builds/sphinx-book-theme/envs/775/lib/python3.10/site-packages/folium/folium.py:303, in Map.__init__(self, location, width, height, left, top, position, tiles, attr, min_zoom, max_zoom, zoom_start, min_lat, max_lat, min_lon, max_lon, max_bounds, crs, control_scale, prefer_canvas, no_touch, disable_3d, png_enabled, zoom_control, **kwargs)
    301     self.add_child(tiles)
    302 elif tiles:
--> 303     tile_layer = TileLayer(
    304         tiles=tiles, attr=attr, min_zoom=min_zoom, max_zoom=max_zoom
    305     )
    306     self.add_child(tile_layer, name=tile_layer.tile_name)

File ~/checkouts/readthedocs.org/user_builds/sphinx-book-theme/envs/775/lib/python3.10/site-packages/folium/raster_layers.py:145, in TileLayer.__init__(self, tiles, min_zoom, max_zoom, max_native_zoom, attr, detect_retina, name, overlay, control, show, no_wrap, subdomains, tms, opacity, **kwargs)
    143     self.tiles = tiles
    144     if not attr:
--> 145         raise ValueError("Custom tiles must have an attribution.")
    147 self.options = parse_options(
    148     min_zoom=min_zoom,
    149     max_zoom=max_zoom,
   (...)
    157     **kwargs
    158 )

ValueError: Custom tiles must have an attribution.
Rich outputs from notebook cells#
Because notebooks have rich text outputs, you can store these in your Jupyter Book as well!
# The ! causes this to run as a shell command
!jupyter -h
Formatting code cells#
Scrolling cell outputs#
The traditional Jupyter Notebook interface allows you to toggle output scrolling for your cells. This allows you to visualize part of a long output without it taking up the entire page.
You can trigger this behavior in Jupyter Book by adding the following tag to a cell’s metadata:
{
    "tags": [
        "scroll-output",
    ]
}
For example, the following cell has a long output, but will be scrollable in the book:
for ii in range(40):
    print(f"this is output line {ii}")
Scrolling cell inputs#
If your input code is long and takes up a lot of your page, you can make it scrollable as well by adding the following tag to a cell’s metadata:
{
    "tags": [
        "scroll-input",
    ]
}
For example, the following cell has a long input, but will be scrollable in the book:
b = "This line has no meaning"
b = "This line has no meaning"
b = "This line has no meaning"
b = "This line has no meaning"
b = "This line has no meaning"
b = "This line has no meaning"
b = "This line has no meaning"
b = "This line has no meaning"
b = "This line has no meaning"
b = "This line has no meaning"
b = "This line has no meaning"
b = "This line has no meaning"
b = "This line has no meaning"
b = "This line has no meaning"
b = "This line has no meaning"
b = "This line has no meaning"
b = "This line has no meaning"
b = "This line has no meaning"
b = "This line has no meaning"
b = "This line has no meaning"
b = "This line has no meaning"
print(b)